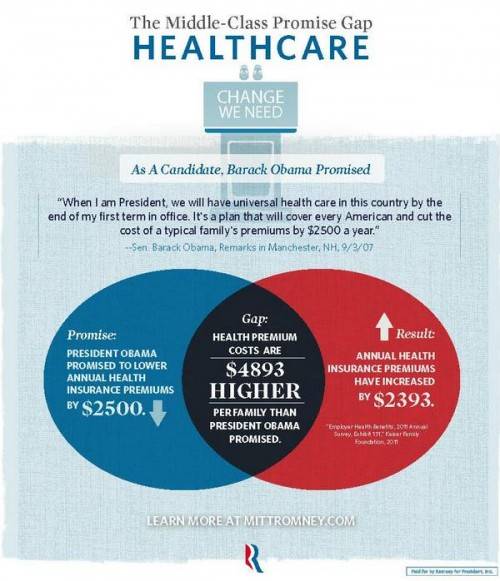
Sociological Images’s Lisa Wade has good concise blog post highlighting the errors in a recent set of graphics released by the Romney campaign. She points out:
Mitt Romney’s campaign put out a set of graphics illustrating a “gap” between what Obama promised and what he has delivered. The graphic is in the form of a Venn diagram, a visual designed to show the overlap between two conditions…
Unfortunately, Romney’s overlapping circles are not Venn diagrams, making the campaign somewhat ridiculous and giving nerdy liberals all over America a good chuckle.
Graphjam also weights in on the subject:
(via Sociological Images and Graphjam)
(h/t Boingboing)


 Infographics