A different kind of Periodic table…
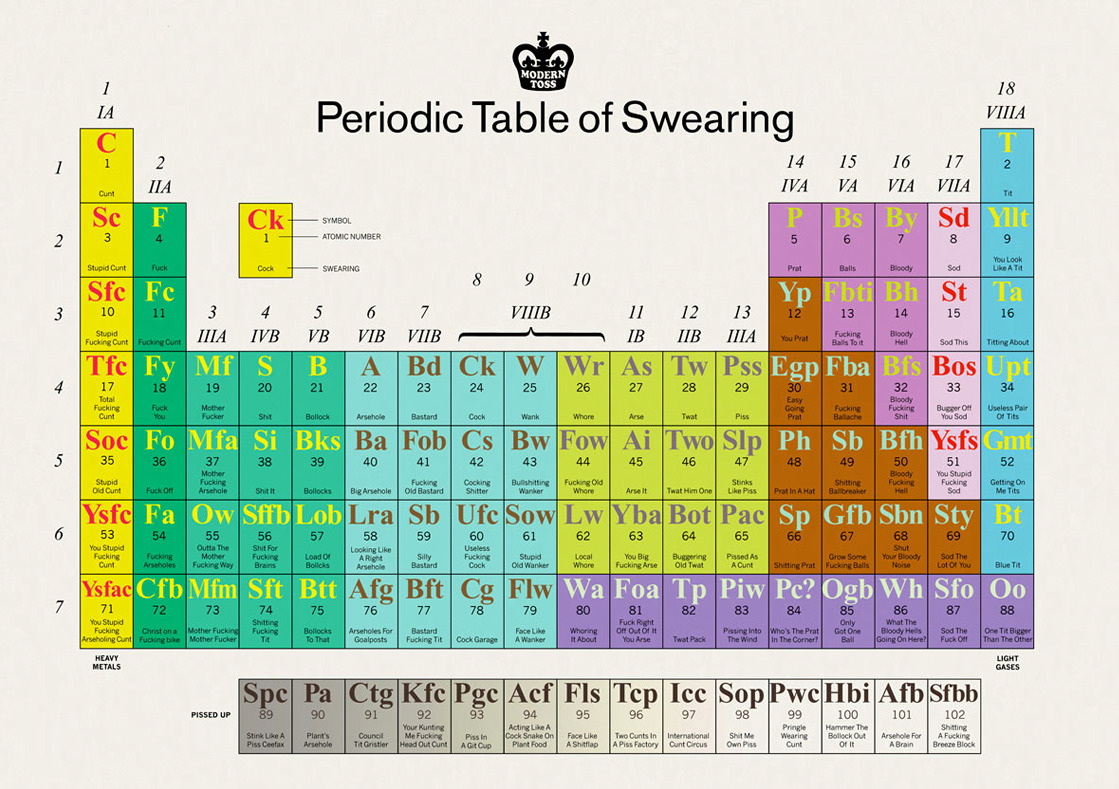
(h/t broadsheet)
A different kind of Periodic table…
(h/t broadsheet)
PhD student Jamie Gallagher maps the countries where scientists were living when they discovered the period elements in the table below. The United Kingdom comes first, followed jointly by Sweden and Germany.
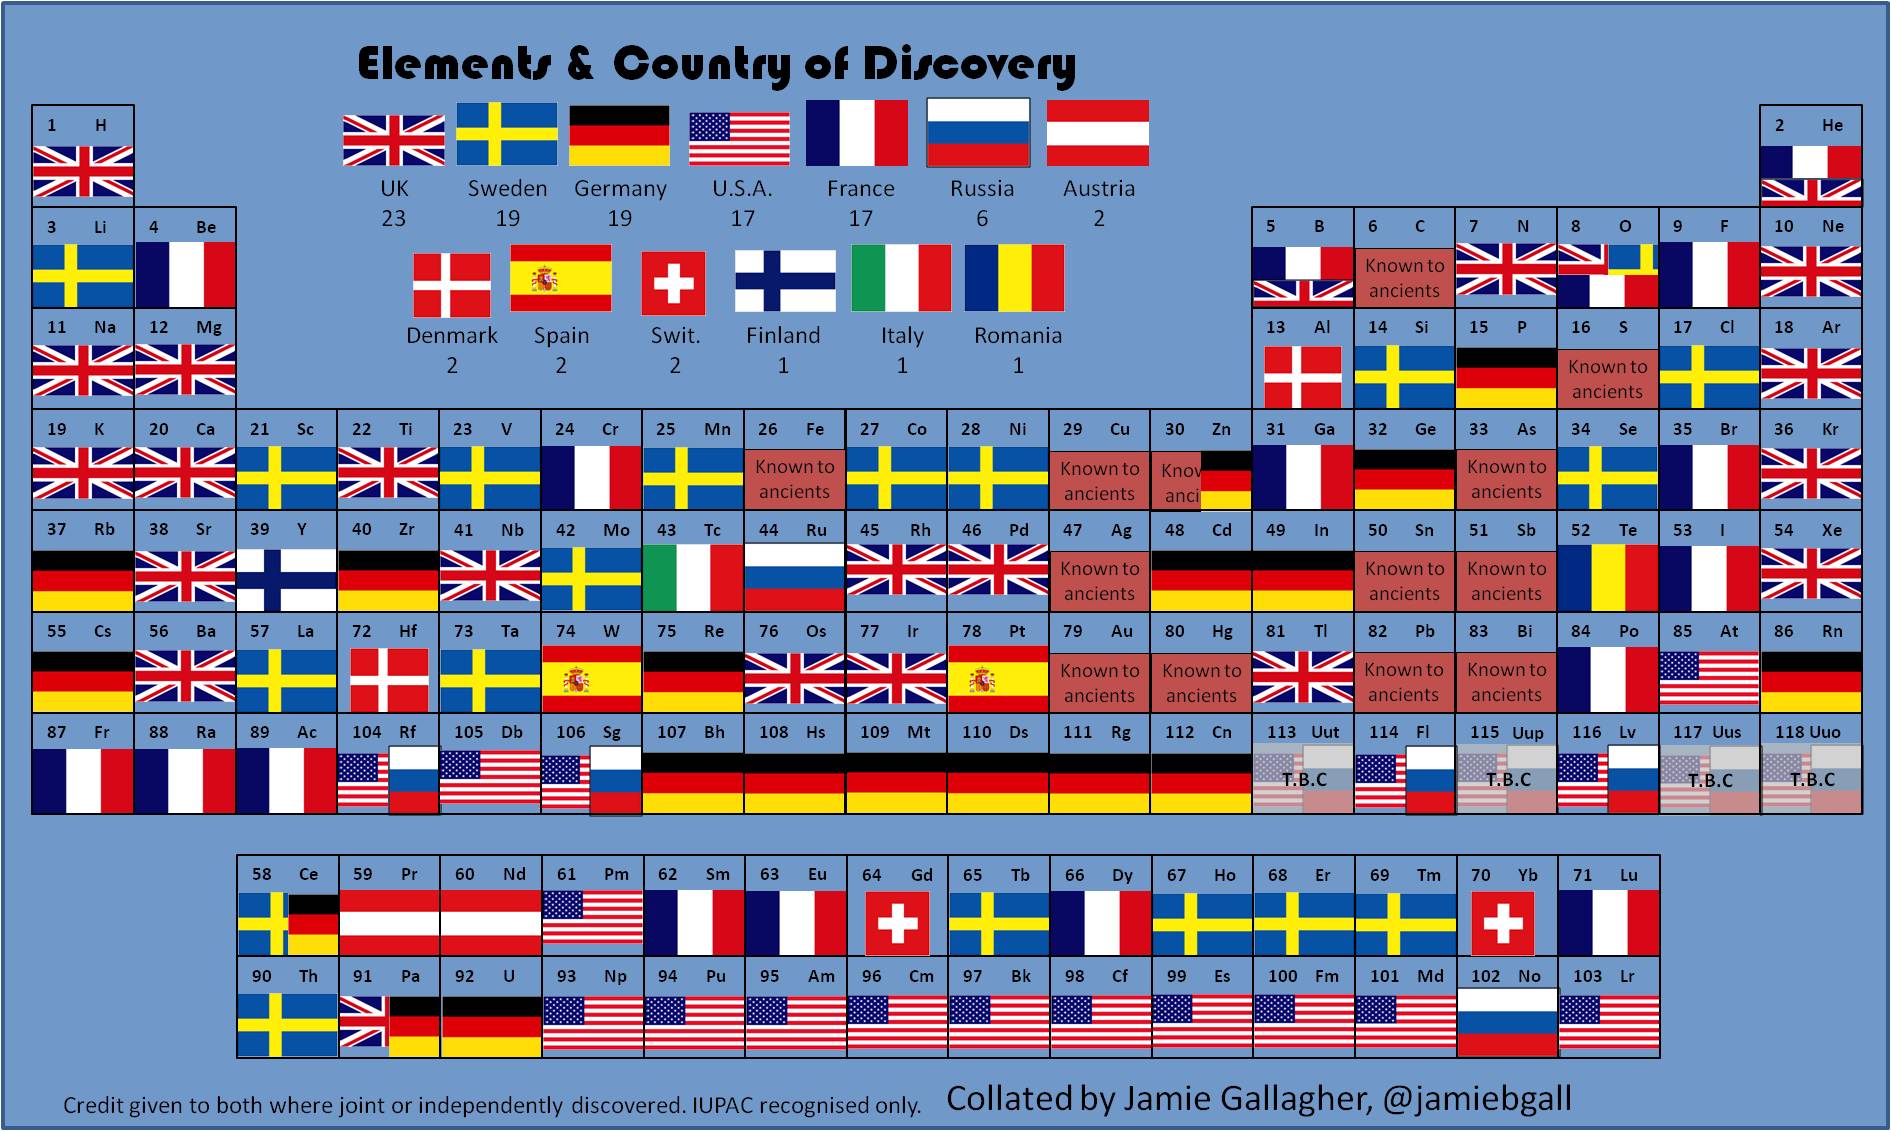
(h/t broadsheet)
A periodic chart by Prof W Sheehan of University of Santa Clara depicting each element of the Periodic table by its relative Abundance.
Roughly, the size of an element’s own niche is proportioned to its abundance on Earth’s surface, and in addition, certain chemical similarities.
H is Hydrogen, C is Carbon and O is Oxygen…but you knew that already. (Periodic table)


