2015 has been a breakthrough year for the New York Times in terms of the breath and reach of its storytelling techniques. Whether it’s through data visualizations or maps, we’ve seen an increase in the scope and breath of graphics to drive narrative and explanation. The news organization has gathered together some of its best examples in 2015: The Year in Visual Stories and Graphics.
My favorites of each category are below:
Visual features
The Dawn Wall – El Capitan’s Most Unwelcoming Route

Longform Stories
Buying Power – The Families Funding The 2016 Presidential Election

Data-Driven Articles
What Drives Gun Sales: Terrorism,Politics and Calls for Restrictions

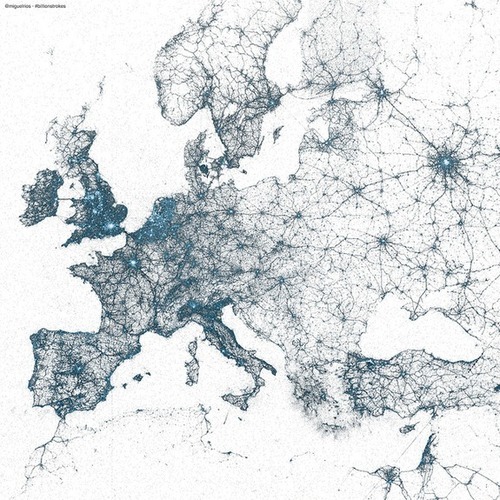
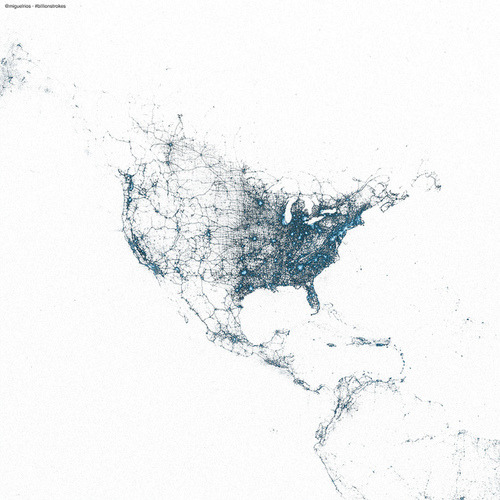
Maps

Motion Graphics and Video Stories
Three Hours of Terror in Paris, Moment by Moment

Data Visualization
TThe Flight of Refugees Around the Globe