Tag Archives: Map

Mapping the World in Tweets – [VISUALIZATION]

The folks over at Twitter have created some astonishing maps using billions of geotagged tweets. Every dot on the maps below represents a geotagged tweet, with the brighter colors showing high concentrations of tweets.

Europe:

Tokyo:

Moscow:

North America:

(h/t worldbank)

Summer 2012 by Google Maps – [INFOGRAPHIC]

The folks over at Google Maps have crafted a nifty infographic outlining the summer search activity on maps.google.com in various countries. From the end of May to the beginning of September, the infographic highlights some of the top-rising searches and most often-searched landmarks on Google Maps.
Summer 2012

From the blog post:

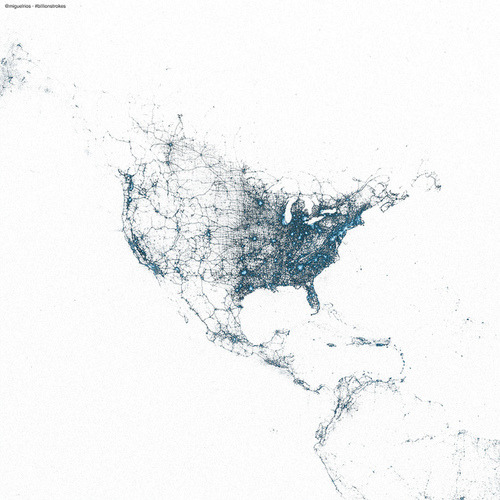
North Americans sought out the best local beaches to help cool off from the summer heat. In comparison, many more people from Spain, Italy and France searched for community swimming pools. In cooler areas of the U.K. the rising Google Maps searches included many indoor activities such as squash, bars and going to the gym. And, as expected, travel was a clear choice for the summer, as indicated by a surge in searches for lodging in almost every region.

Art Map Mashup Visualizations

London’s Most Common Surnames – [VISUALIZATION]

London Surnames

As part of his PdD research at the University College London’s Geography Dept., James Cheshire has produced a series of interactive maps of London show the relationship of common surnames to different London neighborhoods.

This map shows the 15 most frequent surnames in each Middle Super Output Area (MSOA) across Greater London. The colours represent the origin of the surname (*not necessarily* the person) derived from UCL’s Onomap Classification tool. The surnames have also been scaled by their total frequency in each MSOA.

He concludes:

The more you study these maps the more interesting, and perhaps complex, they become.  My final thoughts therefore appear a little contradictory. The first is that a surprising number of Londoners share the same name (especially with their immediate neighbours). The second is that despite the dominance of relatively few surnames at the top of the rankings, the further down the rankings you get the more you see of London’s population diversity.

(h/t boingboing)

Map Travel Video Visualizations

How 300,000 People Move Home – [VISUALIZED]

Norwegian developer Even Westvang created a beautiful animation illuminating how 300,000 of his compatriots move around their country. The visualization (created using a C++ application called Deluge) is based on 4m publicly available Norwegian tax records detailing birth date, income and address details. The underlying data was generated by cross referencing records from 2006 and 2007 to find changes in postal codes.

Deluge from even westvang on Vimeo.

(via Infostethics.com)

Infographic Map Visualizations

Christmas traditions around the world

The folks over Spatial Analysis have a festive map of Christmas variations around the world. Created by Jack Harrison, the map shows information from Wikipedia on global differences in celebrations and traditions.
Mapped: Christmas around the world

(via Spatial Analysis)