Category Archives: Social Networking

Rick Astley’s ‘Never Gonna Give You Up’ – [FUNNY]

UsVsTh3m have created a superb collection of infographics outlining the data behind the lyrics of Rick Astley’s seminal song “Never Gonna Give You Up’. First check the video – its got 64 million hits, then the infographics. 64 million.


(via UsVsTh3m)


Anatomy of Twitter – [FUNNY]

A visual representation of who’s on Twitter. Seems about right to me…

(via Sarahl)

New York: Foursquare check-ins after Sandy – [VISUALIZATION]

Foursquare has released a heat-map of check-ins showing the impact of Hurricane Sandy on check-ins throughout Manhattan. The visualization shows how the southern half of the city, which suffered blackouts and flooding, reflects a steep drop in online activity post-sandy.

(via Gigaom)

Euro 2012 On Twitter – [INFOGRAPHIC]

Sports website TheScore have visualized the 12 million Euro 2012 tweets to produce the infographic below. The data was taken from social analytics company Sysomos and highlights a new tweets-per-second record for sports in the the final match between Spain and Italy.

Some stats from the infographic:

  • Spain had 873,000 mentions during the tournament, England 849,000 and Italy 716,000.
  • Portugal’s top goalscorer Ronaldo notched up 270,000 mentions with Italy’s Mario Balotelli scoring  213,000 mentions and Spain’s Fernando Torres 188,000.

Euro 2012 on Twitter

(h/t mashable.com)

Facebook’s Policing Process – [INFOGRAPHIC]

Facebook provided a rare insight into how it polices the social networking site and its attempts to keep it free of content it deems offensive, illegal or inappropriate.

The infographic below highlights the elaborate reporting system staffed by “hundreds” of people around the world who handle millions of user reports on everything from spam to hate speech or sexually explicit content.

Facebook Reporting Guide

(via HuffingtonPost)

Most Popular Stolen LinkedIn Passwords – [INFOGRAPHIC]

According to the folks over at Rapid7  “Link” was the number one hacked password based on the recent LinkedIn data breach. Other popular passwords included “1234”, “work”, “god” and “job”.

LinkedIn Passwords

(via mashable)

Related:

Password Strength – [INFOGRAPHIC]

There is news circulating today that a collection (estimates of 6.5 million) of LinkedIn passwords have reportedly been posted on a Russian hacker web forum. Linkedin are currently investigating if any security breaches have taken place, and have released a blog post on account security best practices.

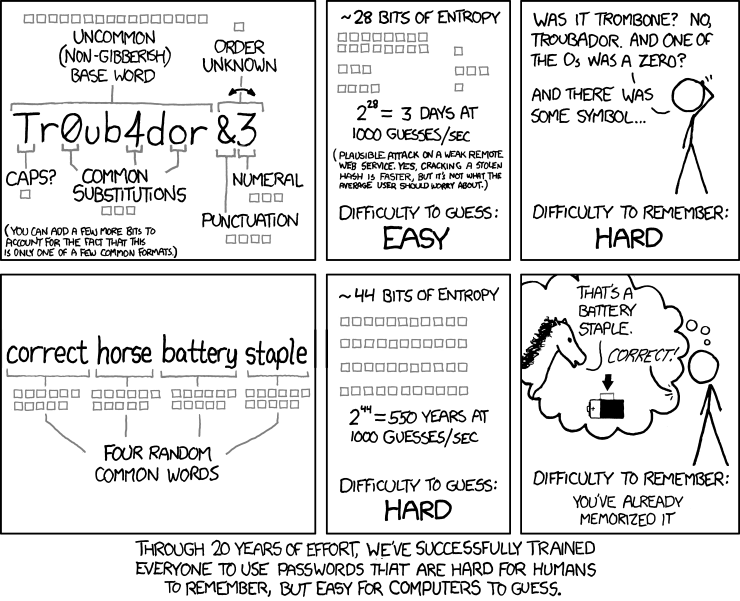
While the passwords remain encrypted – the hackers who stole the data apparently asked others for help to decipher the files. Apparently, the encryption is quite easy to break though, which brings us to xkcd’s insightful infographic below on password strengths.

Password Strength

Also from: Preliminary analysis of LinkedIn user passwords

I thought it’d be fun to try to guess some passwords just based on intuition alone, using LeakedIn to check the guesses. Here’s some of the more entertaining passwords that are in the database: ‘obama2012′, ‘Obama2012′, ‘paladin’, ‘linkedinsucks’, ‘fuckyou’, ‘godsaveus’, ‘ihatemyjob’, ‘ihatejews’ (tsk tsk), ‘manson’, ‘starbucks’, ‘qwer1234′, ‘qwerty’, ‘aoeusnth’ (hello fellow dvorak user!), ‘bigtits’ (really?), ‘colbert’, ‘c0lbert’, ‘bieber’, ‘ilovejustin’, ’50cent’, ‘john316′, ‘john3:16′, ‘John3:16′, ’1cor13′, ‘psalm23′, ‘exodus20′, ‘isiah40′, ‘Matthew6:33′, ‘hebrews11′ (bible verses are quite popular passwords!).

(via xkcd)

SXSWi: Creating Visual Stories – [GRAPHIC]

This year’s South by South West (SXSW) festival saw Ogilvy Notes partner with ImageThink and others to create visual notes for a number of the conference sessions. Artists sketched notes from hour long sessions in real time, and the results of these were made available for free to conference attendees on the OgilvyNotes website.

Sean Parker Presentation

Today’s Observer has an interview with Nora Herting – one of the founding members of ImageThink – in which they explain how they can take complex theories on technology and turn them into dynamic visual stories:

Compressing knotty discussions into easy-to-digest visual stories is hard work. Before they started Image Think in 2009, Herting and her co-founder, Heather Willems, spent four years at a consulting company in New York where part of the job involved what they call “graphic facilitation”. They would turn up at private business meetings and engage the participants by sketching the discussion as it unfolded. Backgrounds in fine art helped, but getting their drawing up to speed took practice.

“We had to very quickly develop a visual language,” says Willems. “Now, if somebody talks about innovation and change, there are immediate icons that pop into my head. We’re constantly trying to develop our skills: listening and synthesising as well as the more graphic components of the work.”

Now, the little start-up is working with some of the biggest organisations in the US, including Google, Disney, Microsoft and Nasa. The advertising and PR giant Ogilvy commissioned ImageThink – Herting, Willems and a small team of freelance illustrators – to sketch the talks at SXSW.

ImageThink in action.

(via Observer)

The Web’s Most Viral News Sources – [INFOGRAPHIC]

NewsWhip – an Irish based News aggregation site – has created the superb infographic below, ranking news sites based on how many viral stories they produced during  January 2012. The definition of a viral story is one getting at least 100 likes or shares (on Facebook) or 100 Tweets (on Twitter).
The top 25 most viral news sources on Facebook and Twitter

(via NewsWhip)

What Are People Doing Online? – [INFOGRAPHIC]

Results from last year’s Pew Internet Study 2011.
What are people doing online?

(via dr4ward.com)