Category Archives: Visualizations

Funny Images Visualizations

‘The Fear’ – [VISUALIZED]

It’s a sensation, a feeling, most Irish people will have experienced at some time in their lives. It’s a saying we’ll all have heard by those in a delicate way on a Sunday or Monday morning. Eoin Whelehan’s visualization documents brilliantly the feelings associated with this experience.

(h/t broadsheet)

Travel Video Visualizations

UK Airspace Infrastructure – [VISUALIZATION]

The folks over at the UK’s main air traffic service NATS have provided a superb example of the daily complexity and volumes of air traffic across the UK and Europe.

UK 24 from NATS on Vimeo.

The visualization provides for

a unique view of the holding stacks over London and how they are a fundamental part of the Heathrow operation, providing the constant flow of traffic that makes it the world’s busiest dual runway airport with 1,350 movements a day.

More at NATS blog.

Art Time-lapse Video Visualizations

75 Hour Illustration in 2 minutes – [TIME-LAPSE]

This 2 minute stop motion time-lapse captures the incredibly intricate and time consuming process of creating a large-format illustration of a Parisian Neighborhood. Created by Guillaume, and taking 75 hours in total, it showcases the astonishing attention to detail and patience it takes to create such a piece of work.

(h/t broadsheet)

Video Visualizations

A Day on the Tube – [VIDEO]

Will Gallia’s superb visualization of 562,145 journeys on the London Underground, representing 5% of Oyster card trips during a week in 2009.

(h/t broadsheet)

Art Time-lapse Time-lapse Visualisations Video Visualizations

A Typical Day in the North Atlantic Skies – [TIME-LAPSE]

The UK air traffic control firm (NATS) have crunched their data on transatlantic flights to produce a stunning visualisation of the “North Atlantic Skies”. The animation covers a typical summer’s day in 2013.

Some statistics from NATS blog post:

  • On a typical July day there are around 30,000 flights across European airspace
  • Approximately a quarter fly within UK controlled airspace
  • The total distance flown by these aircraft is 25 million nautical miles. That’s 998 times around the Earth, or 104 trips to the Moon
  • On 21 June, 5,675 aircraft departed or arrived from UK airports, of which 2,295 departed from or arrived at Gatwick (894) or Heathrow (1,401)
  • 1,532 were overflights
  • The video is 1440x faster than real time

(h/t boingboing)

Graphs and Charts Internet Map Visualizations

The Internet Tube – [VISUALIZATION]

The visualization below, from the Oxford Internet Institute, attempts to simplify the world’s network of submarine fiber-optic cables into a commonly understood subway map.

Each stop on the subway is a node (a place where data is sent and received like an Internet service provider) assigned to a country. The map is generated by taking node data from cablemap.info which“aims to provide a global overview of the network, and a general sense of how information traverses our planet,”.

A higher resolution image is available at geography.oii.ox.ac.uk.

(h/t slate.com)

Art Visualizations

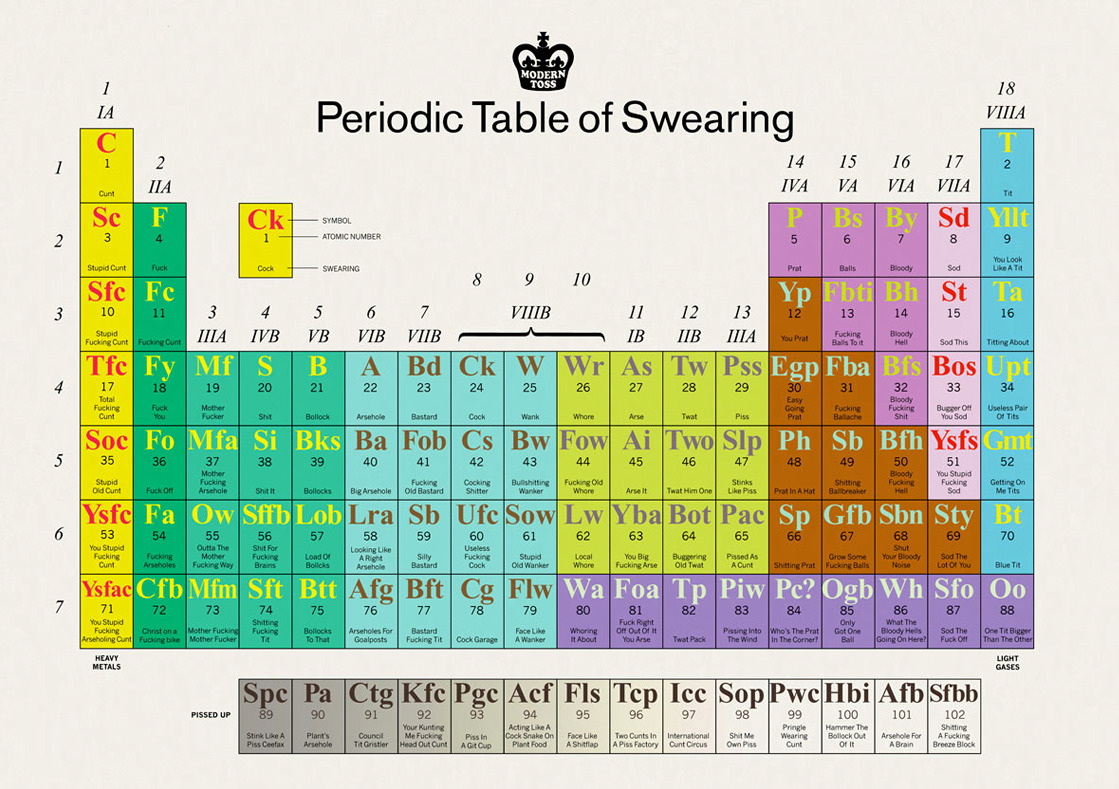
Periodic Table of Swearing – [VISUALIZATION]

A different kind of Periodic table…

(h/t broadsheet)

Graphs and Charts Visualizations

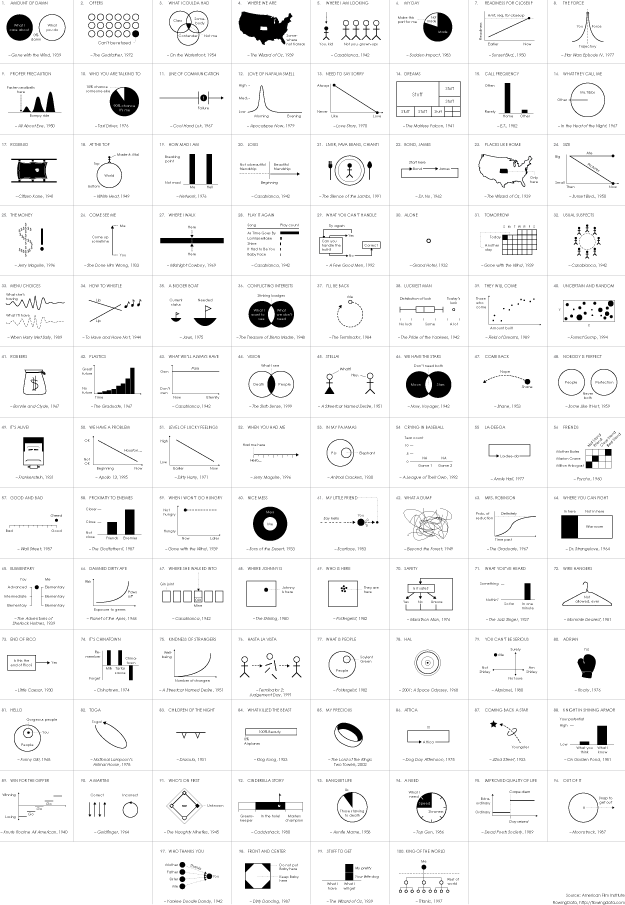
Movie Quotes as Charts – [CHARTS]

FlowingData have visualized the American Film Institute’s 100 most memorable quotes from American cinema. Very clever!

(via flowingdata)

Graphs and Charts Politics Visualizations

2014 Elections Worldwide – [VISUALIZATION]

The Economist’s superb visualization of 2014’s upcoming elections.


(h/t sunlightfoundation.com)

Earth Graphs and Charts Visualizations

Huge Timescales in Perspective – [GRAPHS]

The folks over at wait but why have created a fantastic series of charts representing different timescales in history. They seek to put a wide range of historical moments into a time perspective.

From the blog:

Humans are good at a lot of things, but putting time in perspective is not one of them.It’s not our fault—the spans of time in human history, and even more so in natural history, are so vast compared to the span of our life and recent history that it’s almost impossible to get a handle on it…To try to grasp some perspective, I mapped out the history of time as a series of growing timelines—each timeline contains all the previous timelines (colors will help you see which timelines are which).

For the full series of charts, head to wait but why.


(h/t boingboing)