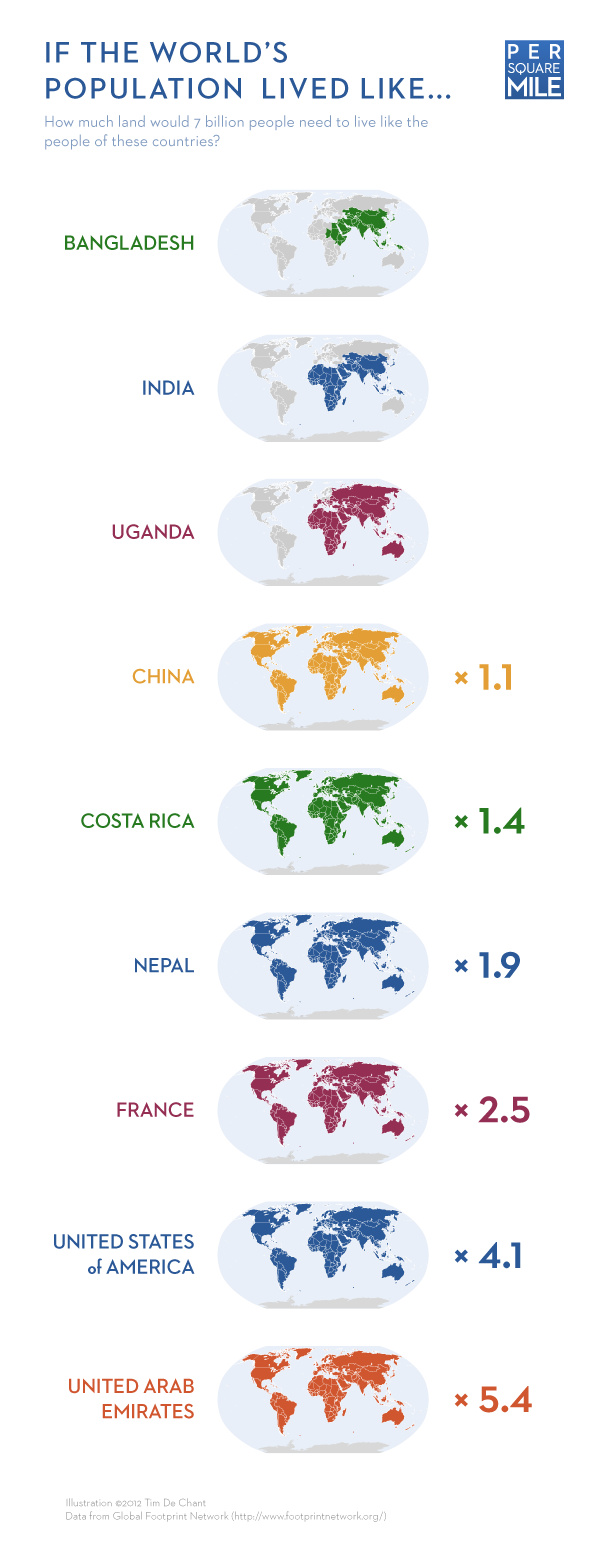
How much of the earth’s space would be taken up if the world’s population liked like the populations of Bangladesh, India, Uganda, China, Costa Rica, Nepal, France, United States, United Arab Emirates.
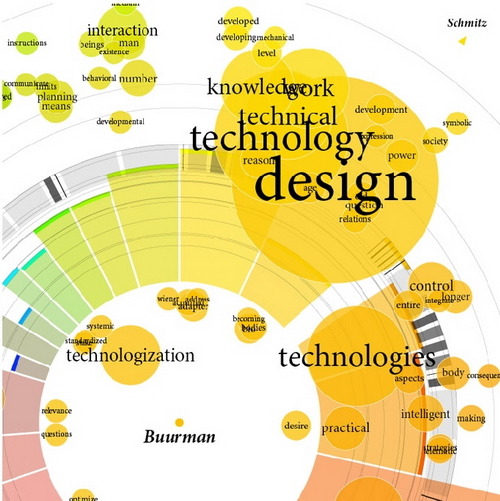
David Friedman (Editor of Smashing Magazine) has crafted together a superb collection of resources representing some of the most interesting modern approaches to data visualization.
The article goes through some fascinating ways to visualize data including: Mindmaps, Ways of displaying news/data/connections and websites. Along with this, the article highlights many useful resources and tools to assist in creating powerful charts, diagrams, maps, statistics and data visualisations. An altogether fantastic resource.
Last month, the Cabinet Office’s Efficiency and Reform Group (ERG) released details of their approach to eradicating wasteful government spending and how this achieved over £5.5 billion in savings for the UK taxpayer.
Strict spending controls were implemented cut expenditure by departments on IT contracts, property, marketing, temporary staff and consultancy. These savings are highlighted in a useful Tree-map and accompanying video below released by the Cabinet Office.
The video – created by the Efficiency and Reform Group in the Cabinet Office and released as part of the same news story – outlines how and where the 2011/12 £5.5bn in savings were achieved. It breaks down the £5.5bn into its component parts (as outlined in the graphic above) to show where and how the money was saved.
Altogether the Tree-map and accompanying video represent a clear and effective mechanism of communicating the breath of savings the Cabinet office ERG group have achieved over the past year.
As part of his PdD research at the University College London’s Geography Dept., James Cheshire has produced a series of interactive maps of London show the relationship of common surnames to different London neighborhoods.
This map shows the 15 most frequent surnames in each Middle Super Output Area (MSOA) across Greater London. The colours represent the origin of the surname (*not necessarily* the person) derived from UCL’s Onomap Classification tool. The surnames have also been scaled by their total frequency in each MSOA.
He concludes:
The more you study these maps the more interesting, and perhaps complex, they become. My final thoughts therefore appear a little contradictory. The first is that a surprising number of Londoners share the same name (especially with their immediate neighbours). The second is that despite the dominance of relatively few surnames at the top of the rankings, the further down the rankings you get the more you see of London’s population diversity.
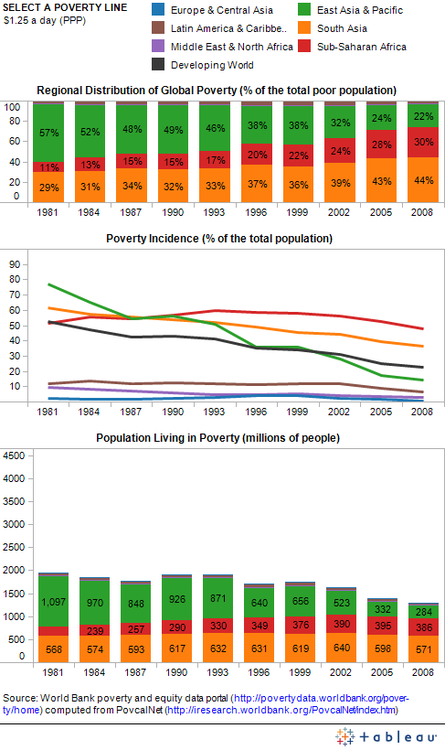
The World Bank just launched a new Data Visualization Tumblr blog dedicated to the latest and greatest open data visualizations on the fight against poverty.
The blog is part of the bank’s Open Data Initiative and will feature “open data visualizations made by economists, graphic artists and all of you open data enthusiasts from both inside and outside the Bank”.
The first visualization presented on the site details Global Poverty Trends and was created using the bank’s re-vamped version of PovcalNet: an interactive on-line computational poverty analysis tool. The team downloaded the table with regional poverty estimates and then used PovcalNet to calculate the results for additional poverty lines. They then combined all the data in the three-panel visualization below – for full interactive version of the chart check out Seeing Between the Lines: Visualizing Global Poverty Trends .
NPR’s Planet Money have a couple of new charts showcasing the change in the immigration as a share of the U.S. population over the past century. Given the rhetoric on immigration it’s interesting to note how this percentage has barely changed over the past 100 years.
The also note:
A century ago, U.S. immigrants were overwhelmingly European. Today, Latin America and Asia are the big drivers of U.S. immigration, and Europe accounts for just a small fraction of the whole.
Ruslan Ekineev created what he calls “The Internet Map,” an interactive visualization charting 350,000 websites from 196 countries. Each website is represented as a “planet”, with size is determined by traffic, and color by national origin. Ekineev explains:
Every site is a circle on the map, and its size is determined by website traffic, the larger the amount of traffic, the bigger the circle. Users’ switching between websites forms links, and the stronger the link, the closer the websites tend to arrange themselves to each other.
A screengrab from the map below shows Ireland’s Internet Map, with the largest website being google.ie. No surprises there.
Fantastic interactive created by the team at the Guardian showcasing Transparency International’s Transparency in Corporate Reporting index. They ranked the world’s 105 largest companies in terms of the steps they take to fight corruption and the openness of its financial self-reporting. Norwegian oil and gas company Statoil was the clear leader, while the Bank of China came in last place. Check out the interactive below which allows you to explore the data, including a breakdown of each company’s score across the three assessed categories (reporting on anti-corruption, organisational transparency and Country-by-country reporting).
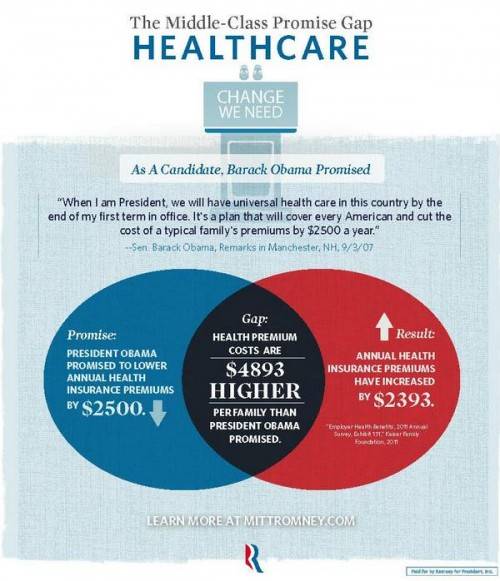
Sociological Images’s Lisa Wade has good concise blog post highlighting the errors in a recent set of graphics released by the Romney campaign. She points out:
Mitt Romney’s campaign put out a set of graphics illustrating a “gap” between what Obama promised and what he has delivered. The graphic is in the form of a Venn diagram, a visual designed to show the overlap between two conditions…
Unfortunately, Romney’s overlapping circles are not Venn diagrams, making the campaign somewhat ridiculous and giving nerdy liberals all over America a good chuckle.