Tag Archives: Visualization

Spending Video Visualizations

Food for $5 – [VIDEO]

The folks over at Buzzfeed have put together a cool visual representation of how much food you can buy or $5 USD in different countries. The foods they look at include bananas, coffee, beef, rice, potatoes, eggs and beer, while the countries investigated are Italy, France, Sweden, Ethiopia, USA, UK, China and Japan.

(h/t flowingdata)

Graphs and Charts Politics Visualizations

Growth in America’s Wealth disparity – [VISUALIZED]

David Cay Johnston writing at Tax Analysts has a superb visualization of the growth in Income inequality in America. The chart below features data taken from the Internal Revenue Service and highlights the growth in income inequality in the USA since the 1960s.
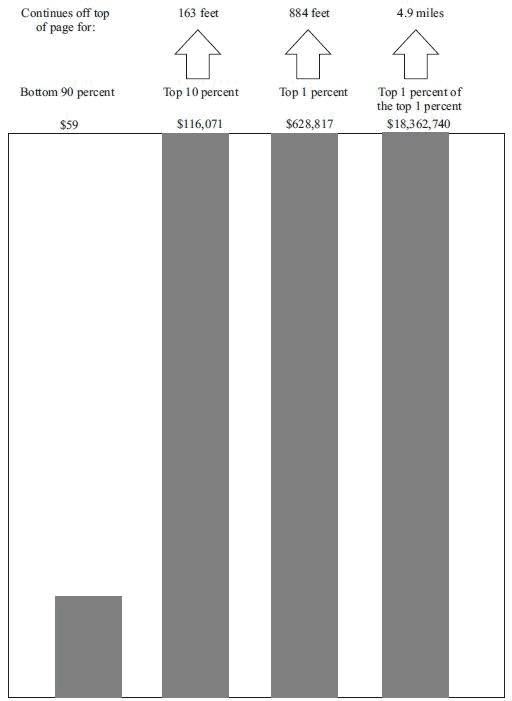
Wealth disparity in America

The bottom 90 percent is represented by an inch-high bar while the growth of the top 10 percent needs a 163 foot-tall bar and the top 0.01% need a 4.9 mile-high bar to represent their wealth growth.

The income growth and shrinkage figures come from analysis of the latest IRS data by economists Emmanuel Saez and Thomas Piketty, who have won acclaim for their studies of worldwide income patterns over the last century.

In 2011 entry into the top 10 percent, where all the gains took place, required an adjusted gross income of at least $110,651. The top 1 percent started at $366,623.

The top 1 percent enjoyed 81 percent of all the increased income since 2009. Just over half of the gains went to the top one-tenth of 1 percent, and 39 percent of the gains went to the top 1 percent of the top 1 percent.

Ponder that last fact for a moment — the top 1 percent of the top 1 percent, those making at least $7.97 million in 2011, enjoyed 39 percent of all the income gains in America. In a nation of 158.4 million households, just 15,837 of them received 39 cents out of every dollar of increased income.

(h/t boingboing)

Art Time-lapse Time-lapse Visualisations Video Visualizations

Writing a Research Paper – [TIME-LAPSE]

Fantastic video from Timothy Weninger visualizing the creation of his research paper to a computer science conference called World Wide Web. The paper went through 463 drafts before the 10 page finished product was released.

(h/t boingboing)

Spending Video Visualizations

5 Years of Mircrofinance Activity – [VIDEO]

What happens when 620,000 lenders fund 615,000 entrepreneurs, students, and other microfinance borrowers around the world? Five+ years of Kiva loan activity (over 4 million lender-borrower connections).

Intercontinental Ballistic Microfinance from Kiva on Vimeo.

Map Travel Video Visualizations

24 Hours of European Air Traffic – [VISUALIZATION]

Lee Armstrong of planefinder.net video showing live air traffic over Europe in November 2012. Their related app had its best day of sales following a Daily Mail claim  that it was an ‘aid to terrorists’.

(via broadsheet)

Politics Spending Visualizations

Obama / Romney Campaign Spending – [VISUALIZATION]

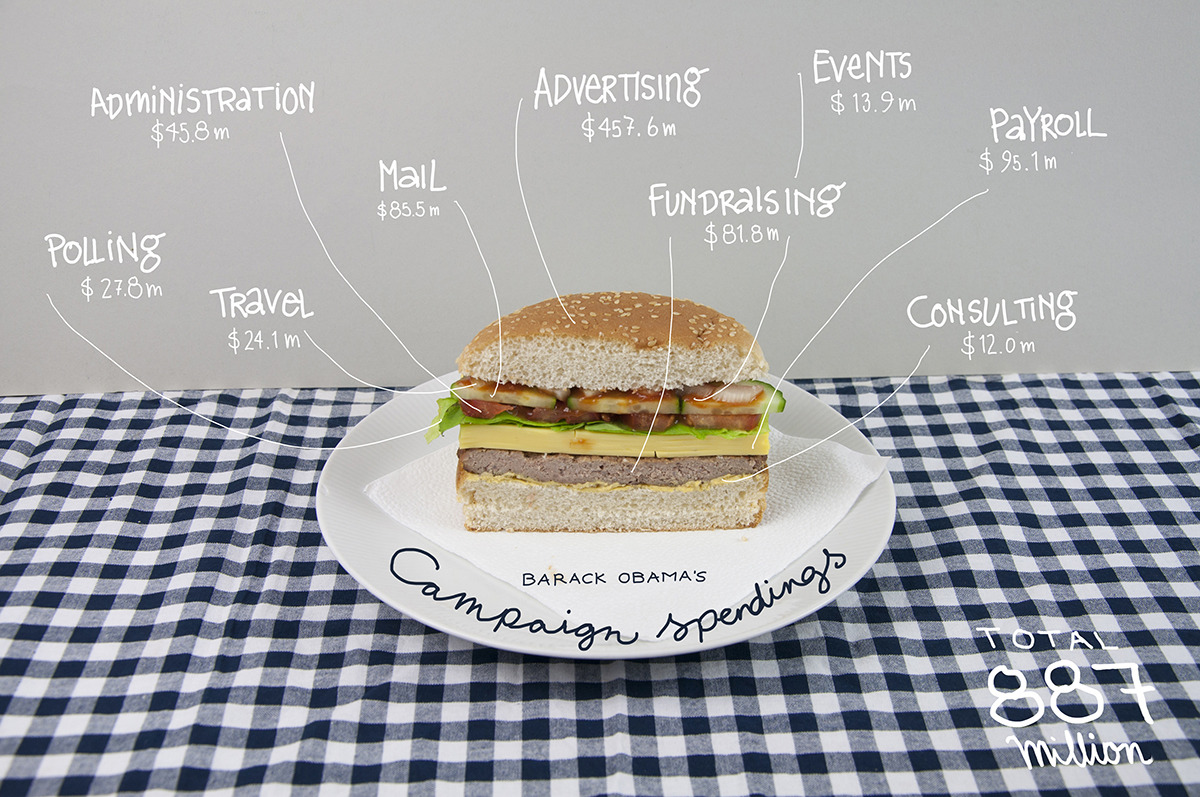
The wonderful tumbler bindersfullofburgers has a couple of great visualisations highlighting where the Obama and Romney campaigns have spent their election dollars.

Obama Campaign
Obama's Campaign Spending

Romney Campaign
Romney's Campaign Spending

(h/t SunlightFoundation)

Graphs and Charts Visualizations

The Elements According to Relative Abundance – [VISUALIZATION]

A periodic chart by Prof W Sheehan of University of Santa Clara depicting each element of the Periodic table by its relative Abundance.

Roughly, the size of an element’s own niche is proportioned to its abundance on Earth’s surface, and in addition, certain chemical similarities.

H is Hydrogen, C is Carbon and O is Oxygen…but you knew that already. (Periodic table)

The Elements According to Relative Abundance

(via Visual.ly)
Government Open Data Visualizations

What Does Your Country Export? – [VISUALIZATION]

The Observatory of Economic Complexity describes itself as a tool that allows users to quickly compose a visual narrative about countries and the products they exchange. Their superb interactive visualization below shows the makeup of Ireland’s 2010 exports.

For the full story of how the country’s exports have changed since 1962 (from 23% live cattle to current 2.1%) , check out the full interactive at The Observatory of Economic Complexity.

It provides:

The observatory provides access to bilateral trade data for roughly 200 countries, 50 years and 1000 different products of the SITC4 revision 2 classification.

The source for the data

1962 – 2000: The Center for International Data from Robert Feenstra

2001 – 2009: UN COMTRADE

The source code for the visualizations is available on github and you can access the data via an API.

(h/t Worldbank)

Earth Images Visualizations

History of Earth – [VISUALIZATION]

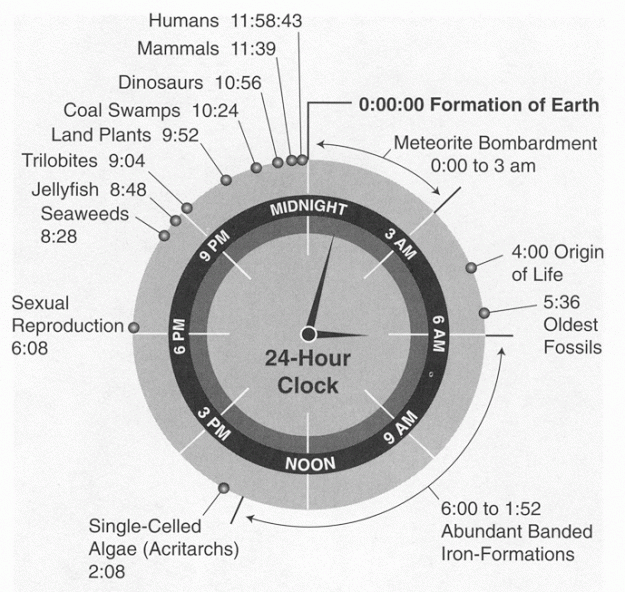
History of Earth in 24-hour clock

The history of Earth in a single 24-hour clock image…puts the experience of the human race on earth into context.

(via exp.lore.com)

Graphs and Charts Infographic Visualizations

Modern Approaches to Data Visualization – [VISUALIZATION]

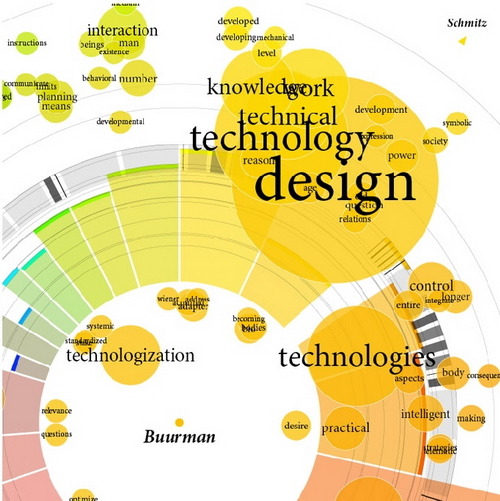
David Friedman (Editor of Smashing Magazine) has crafted together a superb collection of resources representing some of the most interesting modern approaches to data visualization.

The article goes through some fascinating ways to visualize data including: Mindmaps, Ways of displaying news/data/connections and websites. Along with this, the article highlights many useful resources and tools to assist in creating powerful charts, diagrams, maps, statistics and data visualisations. An altogether fantastic resource.
Data visualization - Modern approaches

Check out the full article at Smashing Magazine – Data Visualization: Modern Approaches.