
(via doghousediaries)
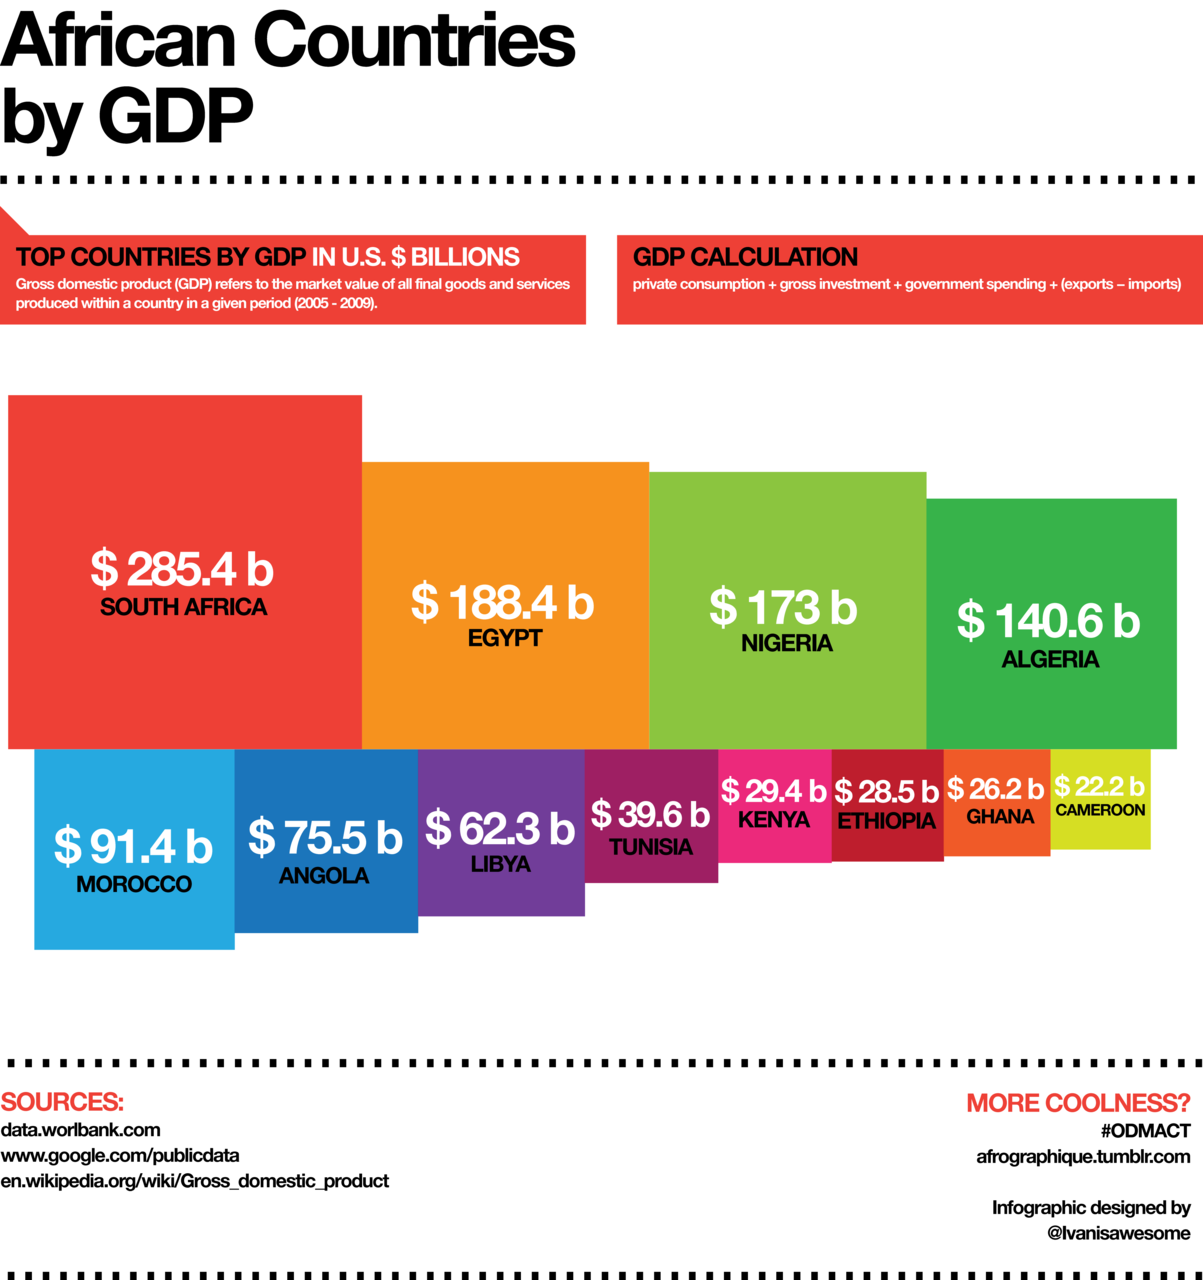
Nice Infographic by ivanisawesome highlighting the huge variations in GDP between different African countries.
(via worldbank)
The inbox has still proved a crucial tool for this year’s presidential candidates, especially for campaign funding. Just about every email I have received from both campaigns have requested monetary contributes.
Email analysis Return Path analysed the data surrounding each candidate’s message and created an neat infographic with it’s results below.
Their analysis reveals GMail users favor Obama while Yahoo! users favor Romney. Obama has has five times more email subscribers than Romney but 5% of his election emails are being marked as spam compared with .8% of Romney email messages.
For more click on the infographic below to read the detail.

(via mashable)
Why Save PBS — some powerful statistics on why America’s Public Service Broadcaster should be protected.

David Friedman (Editor of Smashing Magazine) has crafted together a superb collection of resources representing some of the most interesting modern approaches to data visualization.
The article goes through some fascinating ways to visualize data including: Mindmaps, Ways of displaying news/data/connections and websites. Along with this, the article highlights many useful resources and tools to assist in creating powerful charts, diagrams, maps, statistics and data visualisations. An altogether fantastic resource.
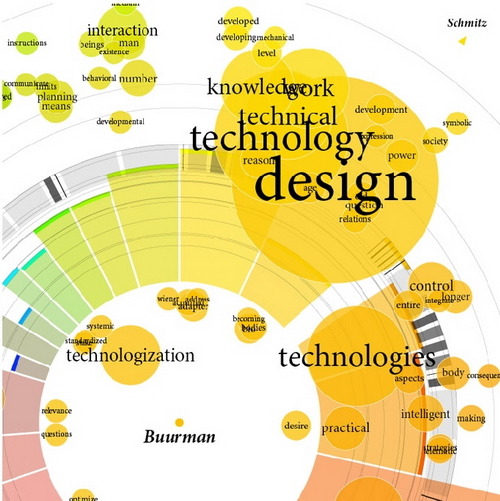
Check out the full article at Smashing Magazine – Data Visualization: Modern Approaches.
The folks over at Google Maps have crafted a nifty infographic outlining the summer search activity on maps.google.com in various countries. From the end of May to the beginning of September, the infographic highlights some of the top-rising searches and most often-searched landmarks on Google Maps.

From the blog post:
North Americans sought out the best local beaches to help cool off from the summer heat. In comparison, many more people from Spain, Italy and France searched for community swimming pools. In cooler areas of the U.K. the rising Google Maps searches included many indoor activities such as squash, bars and going to the gym. And, as expected, travel was a clear choice for the summer, as indicated by a surge in searches for lodging in almost every region.
NPR’s Planet Money team have created a simple infographic to highlight the US Government’s bailout of various industries over the past four years. The infographic highlights that:
while much of the bailout money has been paid back, the government still owns large shares in companies such as AIG and GM, and has yet to recoup some $200 billion in bailouts.

The figures on which the infographic is based come from ProPublica, and are based on funds disbursed by the Treasury Department, but exclude programs launched by the Federal Reserve as part of the bailout. Repayments are based on money recovered by the Treasury through direct payments, dividends, interest, stock sales and other collateral.
Beware, however, as the numbers above do not tell the full story about the cost of these bailouts. For more on this, check The Profitable Bailout? Inside the Real Costs of the Saving AIG and Wall St.
(via Planet Money)
Ireland’s disastrous bank bailout has seen the Government pump more than €64.1 billion into the majority of Irish banks. The effect of this saw the country apply to he EU and IMF for a bailout to keep the sovereign afloat. Newly elected TD Stephen Donnelly reveals the context of this bailout in comparison with other EU countries.
The graphic underlines the impact that the banking crisis has had on the average Irish taxpayer.

(via Stephen Donnelly)
The folks over at thescore created this great infographic a few weeks ago to highlight the differences and similarities between arguably Europe’s two best football leagues. The flamboyance and money of the English Premier League, versus the technical prowess of the Spanish La Liga. The Infographic takes a look how both leagues figure in the world of social media, versus the real world.

(via thescore)


